


TODAY’S INTERCONNECTED FINANCIAL MARKETS DEMAND NEW TRADING STRATEGIES
Intermarket Analysis
Today’s Interconnected Financial Markets Demand New Trading Strategies

By Louis B. Mendelsohn
With the world’s financial markets becoming increasingly interconnected, serious futures and index option traders must now pay closer attention to related markets and their effects on the market being traded. Traders who continue to focus internally on only one market at a time (single-market analysis), oblivious to the underlying intermarket forces or market synergy that drives today’s financial markets, are now at a severe competitive disadvantage and putting themselves at needless risk.
It’s no longer good enough to “keep an eye” on what related markets are doing. A subjective assessment of intermarket relationships through visual examination of price charts or listening to daily news reports is simply not sufficient. Now, new, quantitative methods of analysis, capable of finding hidden patterns and relationships in related market data, are necessary to identify and profit from lucrative trading opportunities.
Complex patterns and otherwise hidden relationships between related financial markets are found through the use of neural networks, allowing the astute trader to discern and act upon trading information reflecting the intermarket dynamics inherent in today’s global financial markets.
THE POWER OF FORECASTING MOVING AVERAGES
This methodology has been incorporated into an intermarket analysis software program that I developed known as VantagePoint, which utilizes neural networks to make forecasts of prices and anticipate the trend direction for various financial markets. VantagePoint’s predictions include the next day’s high and low, the 5-day moving average of closes two days in the future, and the 10-day moving average of closes four days in the future.
By comparing these forecasted moving averages with today’s calculated moving averages, daily oscillators are created which form the basis of a predictive moving average crossover system. This unique approach retains all of the smoothing benefits of traditional moving average systems, eliminates the lag inherent in such systems, and thereby obviates the need to optimize the types and sizes of the moving averages.
Additionally, VantagePoint’s neural networks are trained using the open, high, low, close, volume, and open interest data for the past ten years from the target market and nine related markets that nonlinearly affect the target market being traded, so that the moving average forecasts are not based solely upon past price data on the target market only.
HERE’S AN EXAMPLE OF HOW IT’S DONE
Table 1 is an excerpt of Section 3 from an actual VantagePoint Daily Report for the US Treasury Bond market. This report was generated on Friday, December 8, 1995, for use on Monday, December 11, 1995. It shows predictions for the prior four days which had actually been displayed on earlier Daily Reports. This article will focus only on the PTM column in Section 3 of the report, which displays a moving average crossover oscillator that computes the difference in ticks between the forecasted 10-day moving average for four days in the future and today’s calculated 10-day moving average.
|
Whenever the forecasted moving average crosses above the calculated moving average (in Section 3 the PTM difference turns positive), the direction of the market over the next four days is predicted to be up, and only long positions should be taken or held. This is what happened when the PTM went from negative to positive on November 16, 1995, triggering a long position to be taken on November 17, 1995. (Similarly, on July 31, 1996 a long position was triggered).
Alternatively, when the forecasted moving average crosses below the calculated moving average (in Section 3 the PTM difference turns negative), the direction of the market over the next four days is predicted to be down, and only short positions should be taken or held. This is what happened on February 15, March 5, and April 4, 1996 when short positions were triggered prior to the release of monthly employment data that has roiled the treasury bond market this year.
The magnitude of the difference (the spread between the predicted and the actual moving average) provides an important insight into the market from a momentum standpoint. The narrowing or widening of the spread is an indication of the likelihood of the continuation of the trend and offers an early overbought/oversold warning of a change in the strength of the trend and its direction – often before or just as the market is actually making a top or bottom!
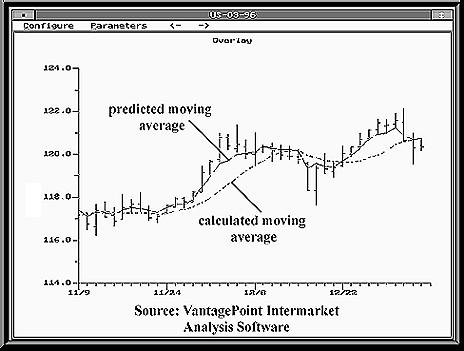
When the difference is positive, but levels off and then starts to narrow, it is an early warning to tighten up on your stop (using the predicted low for the next day), or close out the long position on either the next day’s open or with a limit order near the next day’s predicted high. This is exactly what happened after the PTM oscillator peaked at 41 on December 4, 1995, then dropped to 36 on December 5, 1995. The long position was closed out and profits taken on December 6, 1995. Chart 1 depicts the predicted and actual moving averages for this time period in late 1995. (Coincidentally, the PTM also peaked at 41 on August 2, 1996, indicating that the upside move was about to peter out). Alternatively, when the difference is negative, but levels off and starts to narrow, it’s time to close out a short position and stand aside.
Depending on the size of your account, your trading style, and your risk propensity, you can act on changes in the value of the oscillator in one of several ways. You can either close out the position if there is any amount of weakness, or only close out the position if the weakness exceeds a certain “threshold” i.e. if the PTM indicator narrows by a minimum number of ticks. Otherwise, you would just tighten up on your stop and stay in the position.
THERE’S ALSO A PTS OSCILLATOR
For added confirmation, there is a second predictive crossover oscillator labeled PTS which is also displayed in the third section of the Daily Report. This indicator compares the forecasted 5-day moving average of closes for two days in the future with today’s computed 5-day moving average of closes. The PTS reacts more sensitively than the PTM, typically turning from positive to negative or negative to positive before the PTM crosses.
Additionally, the PTM crossover from related markets such as the Eurodollar and the Five and Ten Year T-T-notes are used as additional confirmation filters to the T-bond predictive information. Frequently the Eurodollar PTM oscillator will cross before the T-bonds PTM oscillator, while the PTM on the two T-none systems help protect against false T-bond PTM crossovers. When used in conjunction with the T-bond report, predictive information from these related markets gives a T-bond trader an outstanding insight into what is likely to happen along the entire interest rate yield curve over the following four day time horizon.
In subsequent articles I will discuss these additional confirmation filters, illustrating examples from the T-bond market in 1996, in which the PTS on T-bonds and the PTM on these related markets can be used effectively as confirmation filters by T-bond traders to identify highly profitable trades while steering clear of marginal trades.
Louis B. Mendelsohn is a prominent trading software developer. In 1983 he was the first person to introduce the system testing capability to microcomputer trading software, with the development of ProfitTaker Futures Trading Software. He is president and CEO of Market Technologies, Wesley Chapel, FL. He can be reached at 800-732-5407 or 813-973-0496, by Fax at 813-973-2700 or Email at lbm@ProfitTaker.comhttp://www.ProfitTaker.com Market Synergy is a trademark of Louis Mendelsohn. VantagePoint and ProfitTaker are trademarks of Market Technologies.