


Trend Forecasting with Intermarket Analysis 2nd Edition:
Predicting Global Markets with Technical Analysis
(Marketplace Books, 2008)
Written by: Louis B. Mendelsohn
Foreword by Jim Wyckoff
INTERMARKET ANALYSIS is the analysis of the relationships between financial markets and their influences on each other; this book explores the application of this process to trading in today’s global economy. It examines the role that intermarket analysis plays in helping traders to identify and forecast changes in trend directions and prices, in view of the unprecedented extent to which global financial markets have become interconnected and interdependent.
Moving Averages are Lagging Indicators
Traditional moving averages have one very serious deficiency. They are a ‘lagging’ technical indicator. This means that moving averages, due to their mathematical construction (averaging prices over a number of prior periods) tend to lag behind the current market price. In fast moving markets, where the price is on the verge of rising or falling precipitously, this lag effect becomes very pronounced.
The lag effect, which to date has been the Achilles’ heel of moving averages, has presented a challenge to technical analysts and traders for decades. Extensive research has been directed at finding ways to reduce the lag, while at the same time retaining the benefits of moving averages.
Strategies that anticipate, not react
Because the main objective of technical analysis is trend identification and forecasting, it would stand to reason that this goal could best be achieved by developing trading strategies that can somehow anticipate changes in trend direction, rather than relying upon trend-following, technical analysis approaches that lag behind the market.
Popular single-market technical analysis indicators such as support and resistance lines, moving averages and chart pattern formations are popular lagging indicators that look internally at an individual market’s past price history and attempt to extrapolate from that data reoccurring price patterns that might prove useful for forecasting. This type of analysis really boils down to looking at what the market has already done and trying to guess where it is going next.
Despite frustration and disappointment with their trading results, many traders still use such lagging indicators, which were first popularized before personal computers came on the scene thirty years ago. Instead, I have advocated that traders, to be successful, need analysis tools that act as leading indicators, so traders can anticipate price action and identify whether or not the current trend is likely to continue or is on the verge of changing direction.
Using intermarket analysis to gain an edge
That realization sent me on a research mission more than two decades ago to see if I could find some way to retain the positive attributes of indicators like moving averages while overcoming their limitations – namely, their lagging nature. After years of studying the markets, observing the transition to global markets and developing countless computerized trading strategies, I began formulating an approach in the mid-1980s that explored the markets from an intermarket perspective. By incorporating the influence of market data from closely related markets in conjunction with price data from a target market, I was able to create quantitative indicators that no longer relied only on past price data for the target market alone but incorporated the effects of related markets.
Past price data for the target market are still an essential component of this analysis, but when combined with price data from related markets, innovative technical indicators can be developed that produce superior analytics when compared to traditional technical analysis indicators or studies using only single-market data. Intermarket data helps transform lagging indicators into leading indicators that can be used to forecast expected changes in market trend direction within a short time span of a day or two into the future with a relatively high degree of accuracy.
Of course, the further you try to look into the future, the less reliable the forecast. Weather forecasters trying to predict the weather for the next six months or a year have a rather spotty record because so many random and unforeseen events can happen to alter weather patterns. In recent years, however, weather forecasters using more advanced forecasting tools have developed a good record for predicting the weather for the next few days.
The same thing is true in trading. It’s impossible to say where the price of crude oil or any other market will be six months or a year from now with any degree of precision. That’s why I have limited the time horizon for forecasting markets to the next few days. Even being able to anticipate price action for a day ahead is still more than enough lead time to provide a trader with a tremendous trading advantage over the masses of traders who still rely only on single-market, lagging indicators.
Changing perspective
It is not good enough to look only at each individual market by itself with popular single-market indicators that look retrospectively at an individual market’s past data in an effort to identify reoccurring patterns that can then be extrapolated into the future. This type of analysis really boils down to looking at where the market has been and trying to where it is going to go in the future.
I prefer to forecast market direction prospectively in a manner that captures the character and nature of today’s globally interdependent financial markets. This can be accomplished by using intermarket analysis tools comprised of leading indicators that can tell you whether an existing trend is likely to continue or is about to change direction, taking a lot of the guesswork out of trading.
The interrelationships of markets have become even more pronounced as the markets have become increasingly globalized. Despite the importance of analyzing intermarket relationships in this context, many traders are still too preoccupied with looking inward at each market, ignoring the interdependencies of the financial markets and their effects on one another.
In addition, technical analysts and traders have made little progress at objectively (quantitatively), not just subjectively (qualitatively), identifying repetitive patterns in market data, which is a necessary step for effective forecasting. It is now imperative for traders to adopt an intermarket perspective and to incorporate intermarket analysis into their trading strategies so they can deal with the global financial markets as they really exist.
Breakout strategies
A basic component of a number of strategies that attempt to capitalize on breakout moves involves a crossover of the predicted moving average above or below an actual moving average. When the predicted moving average line (shown as a gray line on Figure 1) crosses above the actual moving average (typically shown as a black line), the market is expected to trend up. When the predicted moving average line crosses below the actual moving average line, the market is expected to trend down.
With the six different time frames for predicted moving averages and three actual simple moving averages available, VantagePoint provides a number of choices for mixing and matching moving averages of different lengths, from short-term to medium-term to long-term, depending on how sensitive you want these predictive crossover indicators to be.
Figure 1
Wheat 10-day Simple Moving Average
Source: VantagePoint Intermarket Analysis software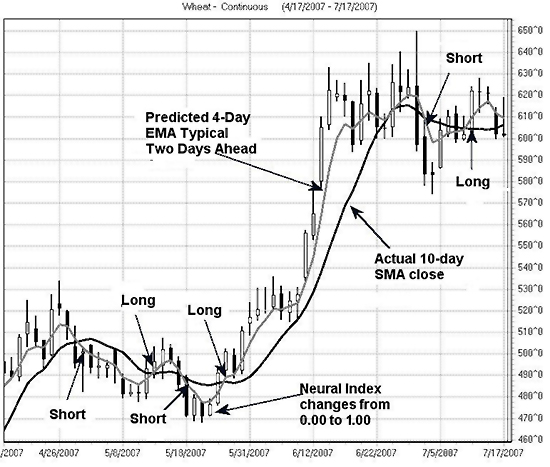
A basic crossover strategy has a few minor missteps in choppy market conditions but more than makes up for them by catching one big trending move on a breakout on this chart. Buying when the predicted 1, 2 and 3 day EMA typical 2 days ahead (P4EMA+2) (gray line) crosses above the actual 10-day SMA close (A10SMA) (black line) and selling when the predicted EMA gray line crosses below the actual moving average black line got you into positions several days ahead of the turns in the actual moving average. More aggressive traders might enter positions at the first turn of the predicted moving average rather than wait for a crossover. Note that the candlesticks on the crossovers generally supported each turn – the bigger black candles (close lower than the open) on the downside crossovers and the bigger white candles (close higher than the open) on the upside crossovers. As with any trading or analysis that you do, strategies developed from intermarket data should be done in conjunction with your experience in reading chart patterns (including candlestick formations), as well as whatever other indicators – even single-market, trend-following ones – with which you are already familiar. And keep one eye on fundamentals and outside events that can produce market shocks that no trading strategy can foresee.
Also, as part of your intermarket analysis, keep track of what the indicators are saying about the markets closely related to the target market you are trading. The eurodollar, 2-year Treasury notes, 5-year Treasury notes and 30-year Treasury bonds, for example, add considerable insight into what is likely to happen to 10-year Treasury notes because these five markets taken together encompass the entire interest rate yield curve from 90 days to 30 years. The more the forecasted indicators on these other related reports confirm the indicators on the 10-year Treasury notes, the higher the probability that the 10-year Treasury note market will act as expected. Similarly, if you are trading crude oil, you need to recognize that this market does not trade in a vacuum, so you should be paying close attention to other related markets including others in the oil complex, the U.S. dollar, gold, etc.
This way, if reports from these related markets give contrary indications, you should be more cautious. Similar confirmations or divergences can be found among the stock sectors and indexes, currencies and many other commodities. Remember, no market trades in isolation in today’s global financial system. They are all related, and to be successful your trading strategies and analyses need to reflect that fact.
Synergistic Market Analysis
As the world’s financial markets have become increasingly integrated, intermarket analysis now plays a crucial role in analyzing and trading today’s global markets, just as back-testing and optimization of single-market trading strategies became integral to computerized technical analysis in the 1980s.
But successful market analysis means more than just intermarket analysis, as has been pointed out previously in this book. Traders have to look at today’s markets from a three-dimensional perspective. In the late 1980s I first wrote about this concept, which I call “Synergistic Market Analysis,” that combines single-market technical analysis, intermarket analysis and fundamental analysis. In effect, it looks at financial market analysis as a three-legged stool in which all three perspectives offer their own unique insight into market dynamics.
Interestingly, due to their robust nature, neural networks are not only well-suited to analyzing markets from both a single-market and an intermarket perspective but can also incorporate fundamental data inputs. These might include the latest supply and demand statistics or economic data such as the Gross Domestic Product, Producer Price Index, Consumer Price Index or employment statistics. Even comparative economic statistics from different countries can be included.
In effect, as the interrelationships of the global financial markets continue to evolve and become even more complex and fast-paced, technical analysis, intermarket analysis and fundamental analysis will need to become blended together. By utilizing the computational modeling capabilities of neural networks in a structured framework that integrates seemingly disparate technical, intermarket and fundamental data, innovative, quantitative trend forecasting indicators can be developed and tested, which will keep them at the cutting edge of financial market analysis for the foreseeable future.