


Forex Trading Using Intermarket Analysis: Discovering Hidden Market Relationships That Provide Early Clues For Price Direction
(Marketplace Books, 2006)
Written by: Louis B. Mendelsohn
Foreword by Darrell Jobman
Most traders stress the role of fundamental information and historical single-market price data in analyzing markets for the purpose of price and trend forecasting. Traders do need to look back at past price action to put current price action in perspective, but they also need to look forward to anticipate what will happen to prices if their analysis is to pay off in the real trading world.
To be able to look ahead with confidence, however, traders need to look in one other direction, and that is sideways to what is happening in related markets, which has a major influence on price action in a target market. What are the external market forces that affect the internal market dynamics – the intermarket context or environment in which the market you are trading exists?
Moving beyond single-market analysis
Intuitively, traders know that markets are interrelated and that a development that affects one market is likely to have repercussions in other markets. No market is isolated in today’s global financial system. However, technical analysis has traditionally emphasized single-market analysis, focusing on one chart at a time and failing to keep up with structural changes that have occurred in financial markets as the global economy has emerged with advances in telecommunications and increasing internationalization of business and commerce.
Many individual traders still rely upon the same types of mass-marketed, single-market analysis tools and information sources that have been around since the 1970s when I first started in this industry. And a large percentage of traders continue to end up losing their trading capital. If you’re still doing what the masses are doing, isn’t it likely that you’ll end up losing your hard-earned money, too?
In the forex markets especially, you cannot ignore the broader intermarket context affecting the market that you are trading. You still need to analyze the behavior of each individual market to see the double tops or broken trendlines or indicator crossovers that so many other traders are following because that’s part of the mass psychology that drives price action. However, it is increasingly important that you factor into your analysis the external intermarket forces that influence each market being traded.
Historical roots
Intermarket analysis is certainly not a new development for traders, having roots in both the equities and commodities markets. You are probably familiar with equities traders who compare returns between small-caps and big-caps, one market sector versus another, a sector against a broad market index, one stock against another, international stocks versus domestic stocks. Portfolio managers talk about diversification as they try to achieve the best performance. Whether they are speculating for profits or arbitraging to take advantage of temporary price discrepancies, intermarket analysis in this sense has been part of equities trading for a long time.
Traders in the commodities markets have also been into intermarket analysis for a long time, trading spreads that have a reliable track record. Farmers have been involved in intermarket analysis for years although they may not have thought of what they do in those terms. When they calculate what to plant in fields where they have several crop choices – between corn and soybeans, for example – they typically consider current or anticipated prices of each crop, the size of the yield they can expect from each crop and the cost of production in making their decision. They do not look at one market in isolation but know that what they decide for one crop will likely have a bearing on the price of the other, keeping the price ratio between the two crops somewhat in line on an historical basis.
The price relationships of corn to soybeans or hogs to cattle or gold to silver or T-bonds to T-notes have been the subject of intra-commodity and inter-commodity spread analysis and have been an integral part of technical analysis of the commodities markets for decades, long before John Murphy and I brought the term “intermarket analysis” into vogue.
The commodities markets, in turn, have a tremendous effect on the financial markets such as Treasury notes and bonds, which have a powerful effect on the equities markets, which have an effect on the value of the U.S. dollar and forex markets, which has an effect on commodities . . . The ripple effect through all markets is sort of a circular cause-and-effect dynamic involving inflationary expectations, changes in interest rates, corporate earnings growth rates, stock prices, forex fluctuations. You can hardly name a market that isn’t affected by other markets or, in turn, doesn’t affect other markets. Whatever the market, assets tend to migrate toward the one producing or promising the highest return. That’s as true for forex as any other market.
You have probably heard the expression, “If the U.S. economy sneezes, the rest of the world catches cold” or that the health of the U.S. economy is the engine that drives the global economy. It works both ways as a sneeze elsewhere in the world can have a significant impact on U.S. markets, as was evident in the Asian financial crisis in 1997 and other incidences over the years that have provided proof, if any was still needed, of how linked today’s global markets are.
Intermarket analysis: The next logical step
So, a quantitative approach to implement intermarket analysis, which has been the basis of my research since the mid-1980s, is neither a radical departure from traditional single market technical analysis nor an attempt to undermine it or replace it. Intermarket analysis, in my opinion, is just the next logical developmental stage in the evolution of technical analysis, given the global context of today’s interdependent economies and financial markets.
Bottom line: If you want to trade forex markets today, you have to use a trading tool or adopt an approach or trading strategy that incorporates intermarket analysis in one way or another. An important aspect of my ongoing research involves analyzing which markets have the most influence on each other and determining the degree of influence these markets have on one another.
HurricaneomicSM analysis is a perfect example of the inter-connectedness of events and markets and how nothing can be looked at in isolation. Take the spate of hurricanes that hit the Gulf Coast and Florida in 2005. They did not simply cause local damage to the economy of those regions. On the contrary, there are hurricaneomic effects that will ripple throughout the world economy for months and years to come, impacting the energy markets, agricultural markets, building materials including lumber, the federal deficit, interest rates, and, of course, the forex market as it pertains to the U.S. dollar. So, hurricaneomic analysis goes hand-in-hand with intermarket analysis in looking at events such as natural disasters and their effects on the global financial markets.
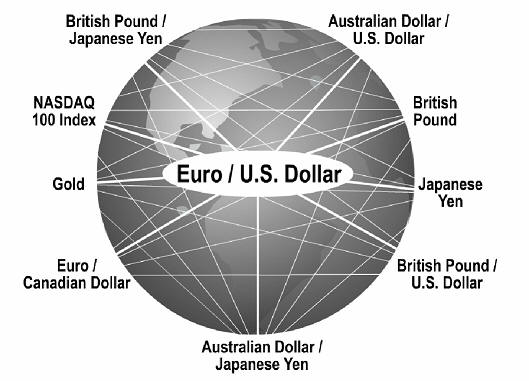
Our research in the ongoing development of VantagePoint since its introduction in 1991 indicates that, if you want to analyze the value of the euro versus the U.S. dollar (EUR/USD), for instance, you not only have to look at euro data but also at the data for these other related markets to find hidden patterns and relationships that influence the EUR/USD relationship (see Figure 1):
- Australian dollar/U.S. dollar (AUD/USD)
- Australian dollar/Japanese yen (AUD/JPY)
- British pound
- Euro/Canadian dollar (EUR/CAD)
- Gold
- Nasdaq 100 Index
- British pound/Japanese yen (GBP/JPY)
- British pound/U.S. dollar (GBP/USD)
- Japanese yen
Figure 1. RELATED MARKETS INFLUENCING THE EUR/USD PAIR
When you are trading the USD/JPY forex pair, you need to take into account another set of intermarket relationships including the following markets:
- 5-year U.S. Treasury notes
- Euro/Japanese yen (EUR/JPY)
- Gold
- Euro/Canadian dollar (EUR/CAD)
- Euro/U.S. dollar (EUR/USD)
- British pound/Swiss franc (GBP/CHF)
- Crude oil
- Nikkei 225 stock average
- S&P 500 Index
Many market inter-relationships are obvious, but others may seem more distant and unrelated, such as the importance of stock indices, U.S. T-notes or crude oil prices on pricing of the USD/JPY forex pair. Research has verified that these related markets do have an important influence on a target forex market and can provide early insights into the forex market’s future price direction.
Additionally, through hurricaneomic analysis, data related to events such as the recent natural disasters in the U.S. can also be incorporated into forecasting models, along with single-market, intermarket, and fundamental data. This results in an analytic paradigm that I call Synergistic Market AnalysisTM.
Gold and oil and forex
In some cases, the correlation is inverse, especially for markets such as gold or oil that are priced in U.S. dollars in international trade. If you look at a chart comparing the price of gold and the value of the U.S. dollar (see Figure 2), you will see that when the U.S. dollar declines, not only do foreign currencies rise but gold prices also rise. Studies on data from the last few years have shown a negative correlation between gold and the dollar of more than minus 0.90 – that is, they almost never move in tandem but almost always move in opposite directions.
Figure 2. GOLD AND THE U.S. DOLLAR – AN INVERSE RELATIONSHIP
This chart clearly shows that gold prices and the value of the U.S. dollar go in opposite directions most of the time, an important input in intermarket analysis.
The value of EUR/USD versus gold prices, on the other hand, shows a high positive correlation – that is the value of the euro and gold prices often go hand in hand, suggesting these markets are both beneficiaries when funds are flowing away from the U.S. dollar (see Figure 3).
Figure 3. GOLD AND THE EURO – A STRONG CORRELATION
When the value of the U.S. dollar rises or sinks, the euro often does the opposite, making it a good match with gold prices if you are looking for two markets moving in the same direction.
So gold prices are an important component in performing intermarket analysis of the forex market. If you see a trend or price signal on a gold chart, it may be a good clue for taking a position in the forex market, where a price move may not have started to occur yet. Or vice versa: A forex move may tip off a gold move.
One of the factors cited for the rise in oil prices is the weakness of the dollar as foreign oil producers viewed increases in oil prices as a way to maintain their purchasing power in U.S. dollar terms (see Figure 4). One way to counter the impact of higher oil prices is a weaker dollar, in what could become a vicious inflationary cycle.
Figure 4. OIL AND THE U.S. DOLLAR – ANOTHER CRISS-CROSSING CORRELATION
As the value of the U.S. dollar declines, crude oil prices, like gold, tend to go up as oil producers try to overcome the effects of a falling dollar. Because of its central role in global economies, oil is a key factor in intermarket analysis of financial markets.
Oil is a key commodity driving global economic growth, and oil prices and forex have a key relationship in the global economy. For example, when oil becomes expensive it hurts the economy of Japan, which has to rely on imports for most of its energy needs. That weakens the yen. High oil prices benefit the economy of a country such as the United Kingdom, which produces oil. That strengthens the value of the British pound.
Because of oil’s standing in world business and commerce, anything that affects its supply or distribution is likely to produce a response in the forex market. That’s why terrorist attacks or natural disasters such as hurricane Katrina, which threaten the normal flow of oil supplies, often cause an immediate response in the forex market. A sudden shift from the dollar to the euro as the designated currency in crude oil contracts, as Mideast oil producers have mentioned from time to time, could also cause an immediate decline in the value of the U.S. dollar.
Although these are the kinds of shocks that make market analysis difficult for any trader, the more typical scenario usually involves subtle movements taking place in intermarket relationships that hint a price change may be coming. If you are not using intermarket analysis, you probably are not going to pick up on all those relationships and the effects they have on markets, as those clues are hidden from obvious view.
Gold and oil aren’t the only commodities affected by changes in forex values. Exports of agricultural commodities account for a sizable share of U.S. farm income. When the value of the dollar rises, it tends to curtail buying interest from an importing nation as the commodity becomes too expensive in terms of that nation’s domestic currency.
When the value of the dollar declines, it reduces the price to an importing nation in terms of its currency and encourages it to buy more U.S. agricultural products. Instead of hedging their soybeans or corn, it may not be too far-fetched to suggest that U.S. farmers should be learning how to hedge the value of their production in the forex market. Cotton is another commodity market strongly influenced by shifts in the forex market, especially with China as a major player in cotton because of its textile industry. Forex traders worried about the impact of China’s revaluation of its currency on the world’s forex market might even think about trading in the cotton market.
The amount of influence that one market will have on another market will naturally shift over time so these relationships are not static but should be the subject of ongoing study. Forex traders should also be aware that the impact from related markets may not be instantaneous. It may take some time for a policy decision or other development to have an impact on the ever-changing marketplace, or an influencing condition may have a bearing on market direction for only a short time, meaning traders may have only a brief window in which to capitalize on a trading opportunity.
Analytical challenge
Intermarket analysis is not an easy task to accomplish for the average forex trader. The complexity of the dynamics between markets and their influences on each other mean that just comparing price charts of two currencies and producing a chart of the spread difference or a ratio between the two prices is not enough to get the full picture of a currency’s strength or weakness or its potential for a price move.
Some analysts like to do correlation studies of two related markets, which measures the degree to which the prices of one market move in relation to the prices of the second market. Two markets are considered perfectly correlated if the price change of the second market can be forecasted precisely from the price change of the first market. A perfectly positive correlation occurs when both markets move in the same direction. A perfectly negative correlation occurs when the two markets move in opposite directions.
But this approach has its limitations because it compares prices of only two currencies to one another and does not take into account the influence exerted by other currencies or other markets on the target market. In the financial markets and especially the forex markets, a number of related markets need to be included in the analysis rather than assuming that there is a one-to-one cause-effect relationship between just two markets.
Nor do the correlation studies take into account the leads and lags that may exist in economic activity or other factors affecting a forex market. Typically their calculations are based only on the values at the moment and may not consider the longer-term consequences of central bank intervention or a policy change that takes some time to play itself out in the markets.
The Canadian and Australian dollars, for example, are considered to be “commodity currencies.” They may be highly correlated when some development influences raw commodity prices in general, and they may move in tandem as the value of the U.S. dollar or other major currencies move in the other direction by varying amounts.
But the Australian dollar is more sensitive to developments in Asia and may be more responsive to what is happening in that area of the world, at least for a while. Likewise, as China’s currency becomes more significant in world currency markets, it may have more influence on the Japanese yen than on other major currencies. Or developments in the British economy may keep the British pound from following the lead of the euro.
Multi-market effect
The forex market is a dynamic marketplace, constantly shifting and evolving. It is not one currency versus the world but all currencies affecting all other currencies to a greater or lesser degree. When you try to examine the multiple effects of five or ten related markets such as forex simultaneously on a target market going back on five or ten years of data to find recurring, predictive patterns, methods such as linear correlation analysis and subjective chart analysis quickly reveal their limitations and inadequacies as trend and price forecasting tools.
Forex market inter-relationships can not be ferreted out with single-market analysis tools. If you are serious about forex trading, you need to make the commitment to get the right tools from the get go, or you are likely to struggle to keep your account intact. Since we are talking currencies here, we might interject another familiar saying: “Penny wise and pound foolish” when it comes to investing in analytical tools.
Of course, no matter what you spend or what tools you use, nothing is 100% correct. Even the best tool can only give you mathematical probabilities, not certainties. But your tools don’t need to be perfect to give you a trading edge.
If you have analytical tools that can find and identify the recurring patterns within individual forex markets and between related global markets, you’ve got all you need to have a leg up on other traders. This insight into price activity over the next few days can give you added confidence and discipline to adhere to your trading strategies and enable you to pull the trigger at the right time without self-doubt or hesitation.
About the Author:
Louis B. Mendelsohn is President and Chief Executive Officer of Market Technologies. Mr. Mendelsohn began trading equities in the early 1970s, followed by stock options. Then, in the late 1970s he started trading commodities, as both a day and position trader. In 1979, he formed Market Technologies to develop technical analysis trading software for the commodity futures markets.
In 1983, Mr. Mendelsohn pioneered the first commercial strategy back-testing and optimization trading software for microcomputers. By the mid-1980s these capabilities had become the standard in microcomputer trading software for both equities and futures, fueling the growth of today’s multi-million dollar technical analysis software industry.
Recognizing the emerging trend toward globalization of the world’s financial markets, in 1986 Mr. Mendelsohn again broke new ground in technical analysis when he developed the first commercial intermarket analysis software in the financial industry for microcomputers. Building on his extensive research in the 1980s involving intermarket analysis, in 1991 Mr. Mendelsohn released VantagePoint Intermarket Analysis Software, which makes short term market forecasts based upon the pattern recognition capabilities of neural networks.